Posts tagged House Pricing
When is the Best Time to Sell Your Home?

The data below is showing seasonality; based on over 15 years of data from the Real Estate Institute.
As you can see, March is the most active month of the year, with January being the least active.

The majority of new property listings tend to flood onto the market in February & March and again in October & November. In fact, 40% of all new listings in a year, come onto the market in these 4 months. The winter season (between the months of June, July and August), has the lowest level at 20% of the annual total of all new listings hitting the market.

Time-Selling-Home-Advice

It is a common tendency among sellers to list either in the spring or summer, as it is warmer and the gardens and property overall is looking in it's best shape, you have more competition as everyone has the same idea!

However, some sellers decide to list in the winter season as they feel it could give their property greater exposure at a time when fewer listings are out in the market to compete with.

At the end of the day, buyers will buy a home that they feel suits their needs - rain, hail or shine so whatever the season, if your home is well presented, well promoted and well priced you are sure to achieve a sale.

Latest Sales Statistics for Manukau

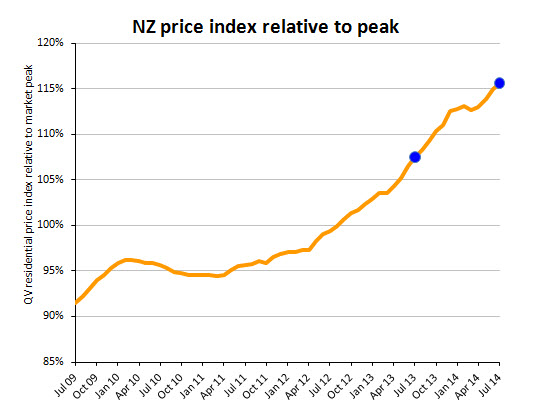
Hot off the press, the latest data from QV reports that the Auckland market has increased 11.7% from this time last year and a 31.8% increase from 2007. Manukau has had a 13.8% increase when compared with selling prices of this time last year. This is normal for this time of year, as soon as Spring sets in I am confident you will see more properties listed and people at the open homes.

There have been reports that “Some properties are sitting around for several weeks with no offers, or below expectation offers which could be due to a ‘disconnect’ between buyer and seller expectations especially where the property requires some form of maintenance or upgrading.”

Contributing factors to this could be the requirement of a 20% deposit; the four successive interest rate increases or the season.

Property-Sales-Report-Manukau

Curious to know how much your suburb has increased in value by compared to the last year? Click here to find out!

What is Driving Up the Auckland House Prices?
Auckland-House-Prices

In my last post, statistics pointed out that investors made up of more than 40% of purchasers within the Auckland region. As we all know, investors typically do not pay as much as the average home buyer would as the numbers must stake up and so forth. So what is the driving force behind these record high asking prices in Auckland then?
Andrew Bruce, president of the Auckland Property Investors' Association feels that one such pressure point is the suppression of building work in this city as the result of the skyrocketing cost of doing business with council. As we know Auckland has a short supply of housing so it may be that the cost to build could be a significant factor here.
Andrew recently subdivided a section and the project took a year to complete. The physical work took only three weeks, the paperwork took 49.

Costs to complete a subdivision
Direct council costs (including consents and development contribution) 46%
Surveyor 24%
Contractors 28%
LINZ and lawyer 2%
Total 100%

Andrew has calculated from this experience, the council costs to the value of the section were 20% of the actual sale price of the section (including installation and connection of the water meter).
In many cases, a proposed building project is not economically viable by financiers, investors, and developers, and this is the cause of our housing supply being unable to keep up with the growing demand.
Source http://www.nzherald.co.nz/personal-finance/news/article.cfm?c_id=12&objectid=11297174